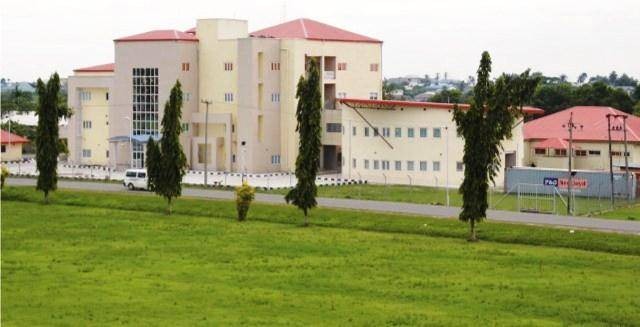
615 Students Advised to Withdraw in RSUST Over Low CGPA:
In a bid to uphold the academic excellence for which the institution has been known, a list of a total of six hundred and fifteen (615) names of students of the Rivers State University of Science and Technology was published at the beginning of the new 2013/2014 academic session.These students have therefore been advised to withdraw as a result of their very lowacademic performance in the 2012/2013 academic session.
This coming on heels by the management of the university is to ensure adherence to its long time standing rule that students who are not able to meet a minimum 1.0 CGPA at the end of any academic session will be asked to withdraw. However, the complexity of manually managing examination records in time past has made it rather difficult to compute and track down students’ results and progress.
Similar Posts:
Howbeitin recent times, with the use of ICTs for computation and storage of examination records, retrieval processes and academic report generation has made the search for students with a CGPA less than 1.0, less cumbersome. With the use of ICTs have been made easy the computerisation of results, computation and storage, retrieval of such results and search for all students who have a CGPA of less than 1.0 has become easy and less cumbersome; making it easy for the Management of the University to get the list of students who fall within this category promptly.
This has not only helped the students to know their academic position, but has also delivered the university from undue litigations which often follow the release of such list. Students involved in this category in times past often sued the school for not informing them as at when due and insist on being reinstated since they might have even paid all fees and carried out all registration activities before the release of the list.
With the advent of the e campus portal, the situation has greatly improved and eliminated the embarrassment usually faced by the school authority. The following graph shows the distribution based on the level of the students advised to withdraw.


